Big names like Jamie Oliver, Byron, Strada and more have closed restaurants in the past couple of years, and others have responded to the market with discounts, budget menus and other price-cutting measures.
However, when combined with cost pressures such as rising business rates, increases in the National Living Wage and the rise of high street rents, the pressure on margin is a recipe for disaster. Added to that food prices have risen (largely due to the falling pound), and Brexit still provides some uncertainty here in the UK.
All of these things are out of our control, but all of them impact ALL restaurants. So why do some fail, when others are expanding?
The answer, obviously, lies in the way they are managed and operated.
One of the fundamental things that all business advisers and directors pay attention to is the empirical evidence that reflects exactly how well (or otherwise) a business is being run. Of course, I’m not just talking at the end of each financial period, but regular key performance indicators, measured daily where appropriate.
But which restaurant KPIs are the best to use and why?
In any industry, the best KPIs to choose are those that, when acted on, drive profitable growth. And the very best of those are the ones that are easy to calculate and easy to act upon.
Let's look at some commonly used restaurant KPIs and consider their relevance to restaurant profit and loss.
1. Overall profitabilty
On average we'd expect restaurants to be showing an overall profit up to 15% with a median average of around 3-5%. But that really doesn't paint the picture. If you're at the top end and falling, why is that? If you are at the lower end, how do you improve?
The devil is in the detail, as they say, and the best restaurants are very granular about their KPIs.
2. RevPASH (Revenue per available seat hour)
RevPASH is used by many restaurants and was originally developed by Dr Sheryl Kimes of the Cornell University School as a way of factoring both time and available capacity into the equation.
RevPASH = Total Revenue / (Number of Seats x Hours Open)
However, we feel that doesn't take account of the "real" capacity of the available space. Adding tables and/or changing table sizes could improve the potential PROFIT per square foot, so long as this doesn't adversely impact the customer experience.
Also, if a delivery or take-away service is offered*, the revenue per available seat hour becomes pretty useless.
* Deliveroo and UberEats have created deliver services for over 85,000 pubs and restaurants in the UK.
3. Profit per square foot
Profit per square foot is a good measure. It's easy to measure and there are several levers that can be tweaked to improve profit per square foot.
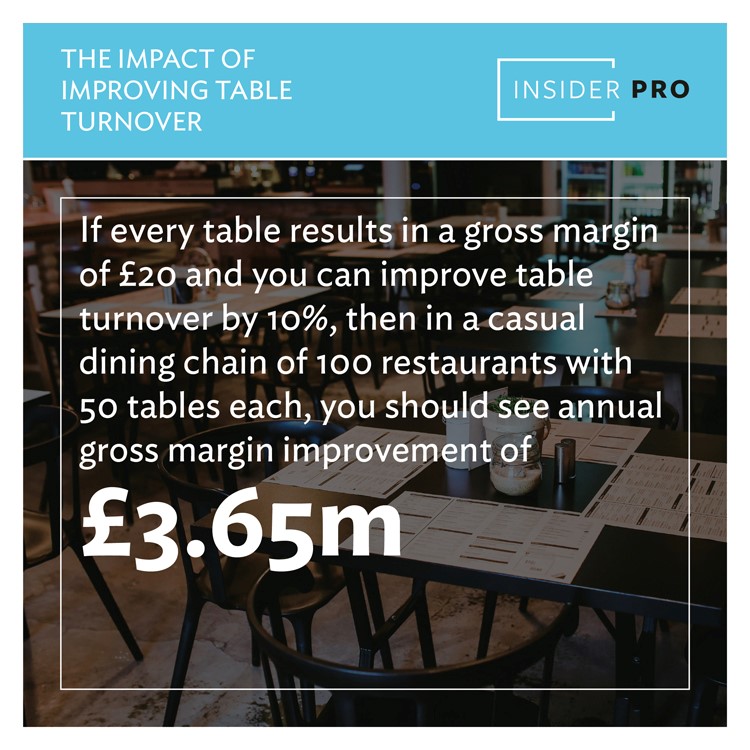
In a pure-play restaurant the main options are to raise prices or increase table turnover. In the current climate, raising prices isn't a popular choice, so table turnover has become a key improvement metric in itself. (More of that later...)
Using profit per square foot will inform the restaurant about space planning decisions, eg the space given to the bar area will depend on the profit per square foot that can be generated from space around the bar vs the profit per square foot from a dining table....always bearing in mind the customer experience, of course.
Profit per square foot is also a useful measure to compare the profitability of the establishment with or without takeaway or delivery service.
However, whilst profit per square foot in restaurants is a useful headline metric, if things are going wrong, there are other restaurant KPIs that will help to pinpoint the underlying problem(s).
4. Revenue per labour hour
Unlike some foods, and most beverages, you can't keep today's labour hours and use them tomorrow! So, keeping a check on labour efficiency is key.
Breaking this metric down by day or shift could help you identify any regular over-staffing issues at particular times of the week. Of course, there is a core team needed regardless of sales volume, but it's an easy metric to calculate that may help spot opportunities for improvement.
Then there is the time before the restaurant opens, when staff are paid and no revenue is being made. How do you minimise that cost? Is it possible to get the prep work done with less labour hours? Even cutting a few minutes of prep time across a large restaurant group could add hundreds of thousands to the bottom line!
If staff are asked to arrive just 15 minutes later (saving 15 minutes of wages), and you have 5 staff in each of 75 restaurants operating 365 days per year, that could amount to adding over £340k profit to the business!
5. Sales per head
Average revenue per member of staff, monitored over time is easy to calculate. You'll need to factor in any short term discounts applied when looking at trends over time, but for most this will give an early warning signal of issues in the business.
If revenue per head is falling, it could indicate more "up-sell" training is required.
6. Table turnover
Improving table turnover means being able to accommodate more diners in the available space.
Reducing the average time guests spend at a table of particular importance for casual dining restaurants. Both the restaurant AND the customer expect it!
For ideas about improving table turnover take a look at our blog "4 ways to improve average restaurant table turnover rate".
7. Customer feedback
Getting feedback directly from your patrons via TripAdvisor, a card presented with the bill (maybe with a small incentive against their next visit), or a point of sale app is invaluable.
Comments should be monitored and responded to where appropriate. But the key is to obtain quantifiable feedback and to maintain a careful watch over the scores to spot early warning signals.
We aren't talking about a simple overall rating here. Testing out what customers think about particular aspects of their experience is vital. Measuring their feelings against the company goals is probably the best advice here.
Giggling Squid's goal is to be the first truly national Thai restaurant. Wagamama want to be known for "True Nurishment". Nandos have focused on sustainability as as one of their key goals. Every business has their own, unique goals, so considering checking in with customers how well they feel you are doing against those goals can be enlightening.
8. Employee turnover
This is sometimes overlooked, but employee turnover is often reflects, and creates, issues in the business. Finding out why people are leaving and solving the problem is an investment in management time that can reap rewards in many areas of the business:
- an improved perception of the business from regular cusotmers
- reduced time (in the future) on recruitment and staff training
A step up from slowing down employee turnover, is to increase employee engagement. A Gallup survey in 2016 showed that companies with highly engaged employees achieve 21% higher profitability. This corroborated an earlier study by AON Hewitt across 2900 companies and 6.7 million employees that reported firms who could demonstrate the highest levels of employee engagement generated shareholders returns 22% above average. Those firms with low levels of employee engagement, however, showed shareholder returns around 28% lower than average.
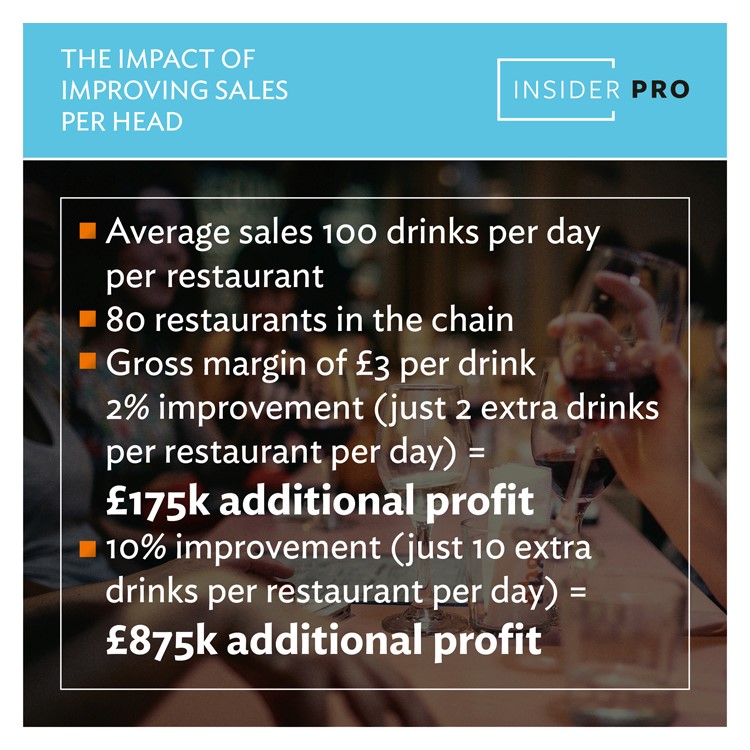
9. Drinks per head
This is an interesting detailed little metric that we like to use (in addition to the above) when we're helping casual dining restaurants to improve profitability and grow their business.
If you simply asked staff to offer drinks more often, and they sold more drinks as a result, what impact would that have on your bottom line?
In a restaurant chain that sells 100 drinks per day at each of its 80 restaurants, a 2% improvement (an extra 2 drinks sold per day) could result in an additional gross profit of around £175k. A 10% improvement (just 10 extra drinks per restaurant per day) could add £875k profit.
Our eBook - The Secret Sauce of Restaurant Chain Profitability - provides 60 pages of wisdom and practical suggestions based on our experience of working with Casual Dining Restaurant Chains. Alongside setting KPIs, this eBook discusses the drivers in the industry and delivers 18 practical ways to improve restaurant profit.
Need a quick fix? Challenge one of our restaurant consultants to discover how much profit you're leaving on the table.
More about restaurant KPIs: